Accessibility Reports
Accessibility reports give you a polished, downloadable PDF that summarises your site’s accessibility status. They’re designed to be shared with senior management, attached to board packs, or included in compliance reviews — without requiring anyone to log into A11y Pulse.
Each report tells the story of where your site stands: how many issues were found, what’s passing, and whether things are improving over time. It frames results with context, not just numbers, so the reader walks away with a clear understanding of progress.
Contents:
- Generating a report
- Previewing your report
- White-label branding
- What’s in the report
- Downloading the PDF
- Good to know
Generating a report
You can generate a report from two places:
- From a scan: Open any completed scan and click the Download PDF Report button in the header.
- From a site: On your site’s dashboard, click the Download PDF Report button. This uses the latest completed scan for that site.
Both take you to the report preview page, where you can review the content before downloading.
Previewing your report
The preview page shows exactly what the PDF will contain, rendered as a scrollable page. Use this to check the content before generating the final document.
At the top of the preview you’ll find:
- Back to Site/Scan Details — returns you to the site or scan you came from
- White-label branding toggle — swaps A11y Pulse branding for your own (shown once you’ve set up branding; see White-label branding)
- Show detailed results toggle — includes or excludes the full audit breakdown (on by default)
- Download PDF — generates and downloads the PDF
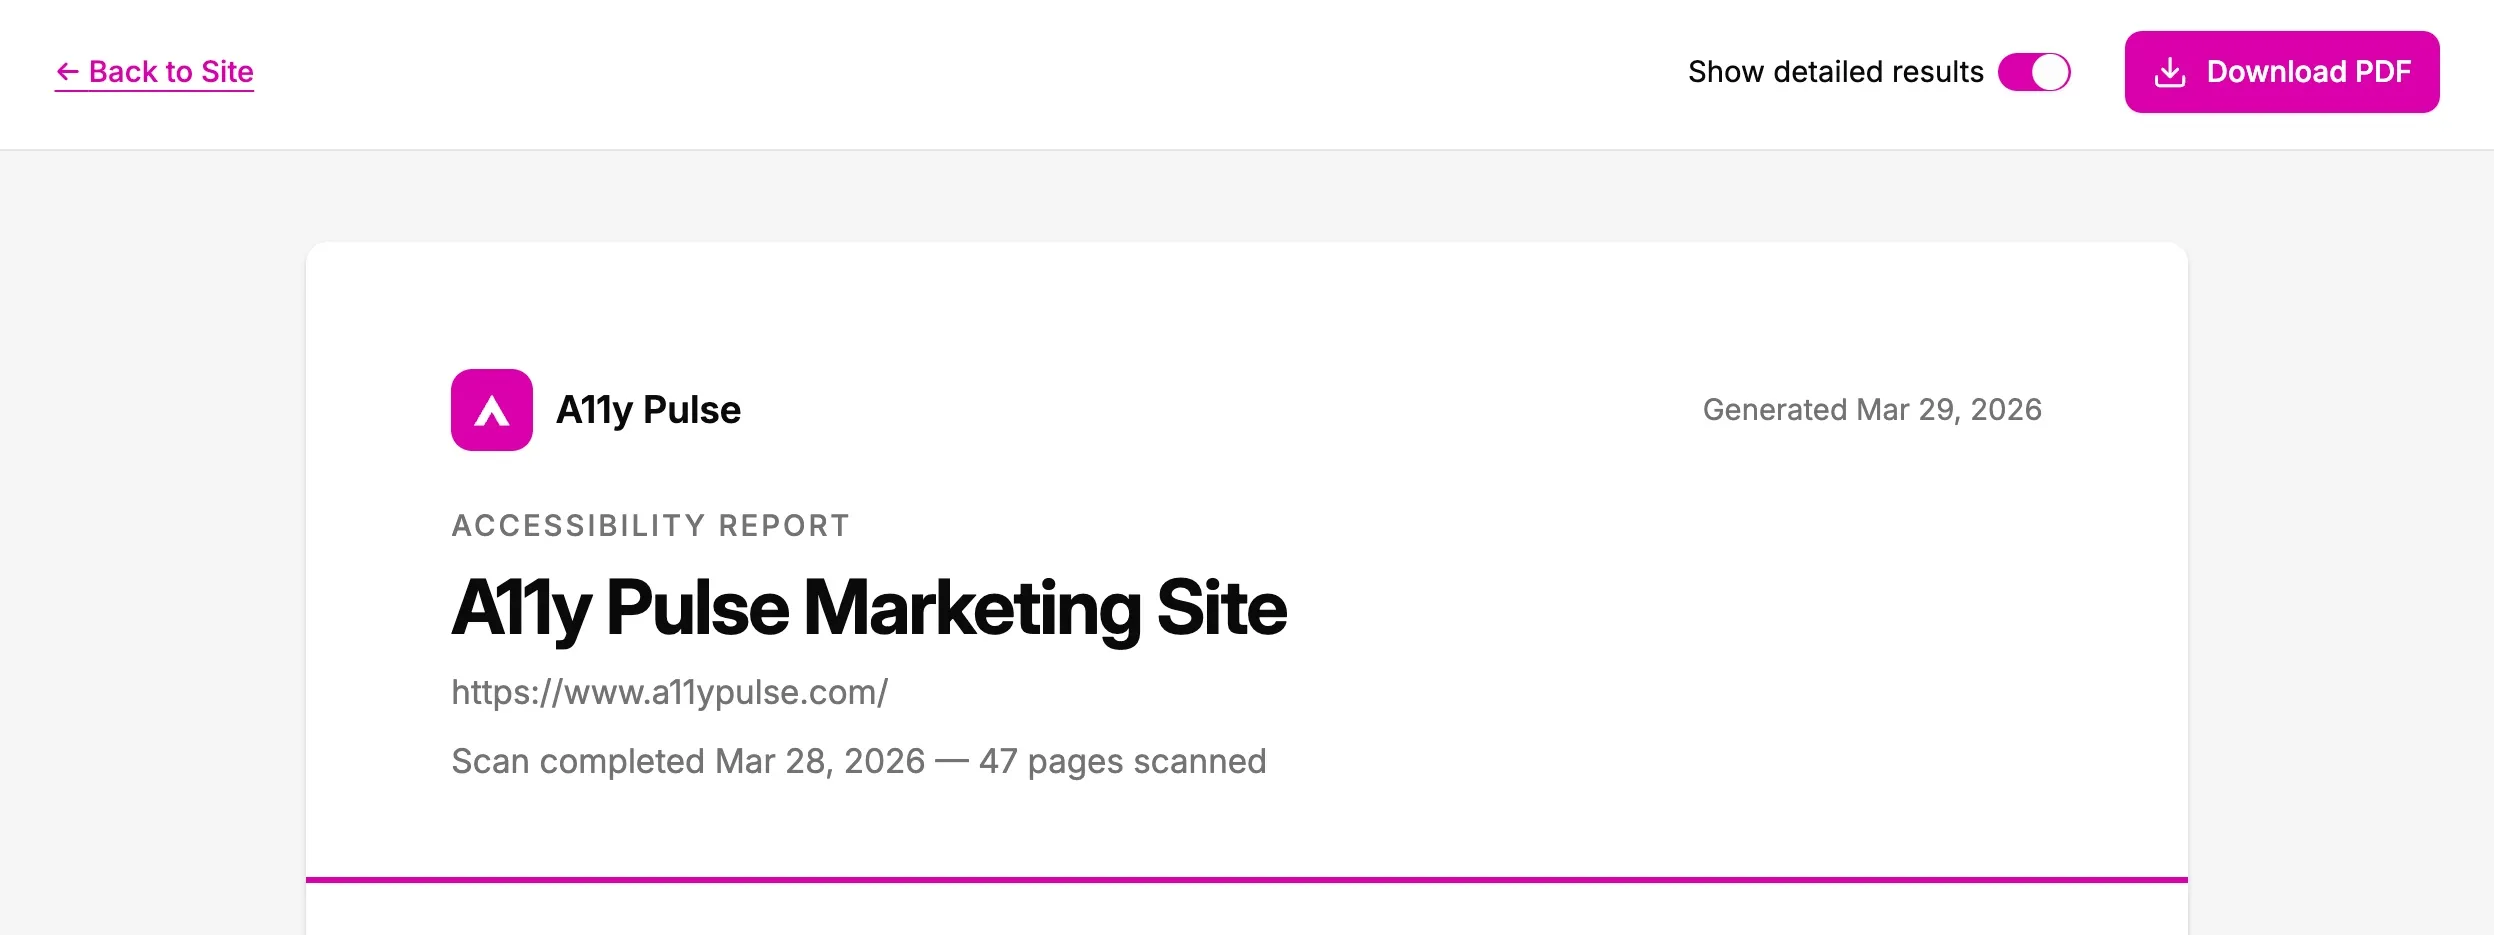
Toggling “Show detailed results” updates the preview immediately so you can see what the PDF will look like with or without the detailed appendix.
White-label branding
If you run audits for clients, you can white-label your reports so they carry your own branding instead of A11y Pulse’s. Your agency logo and name replace ours on the report cover and footer, and our brand pink is replaced with neutral greys. Branding applies to both the downloaded PDF and the in-app preview.
Setting up your branding
Branding is configured once per team:
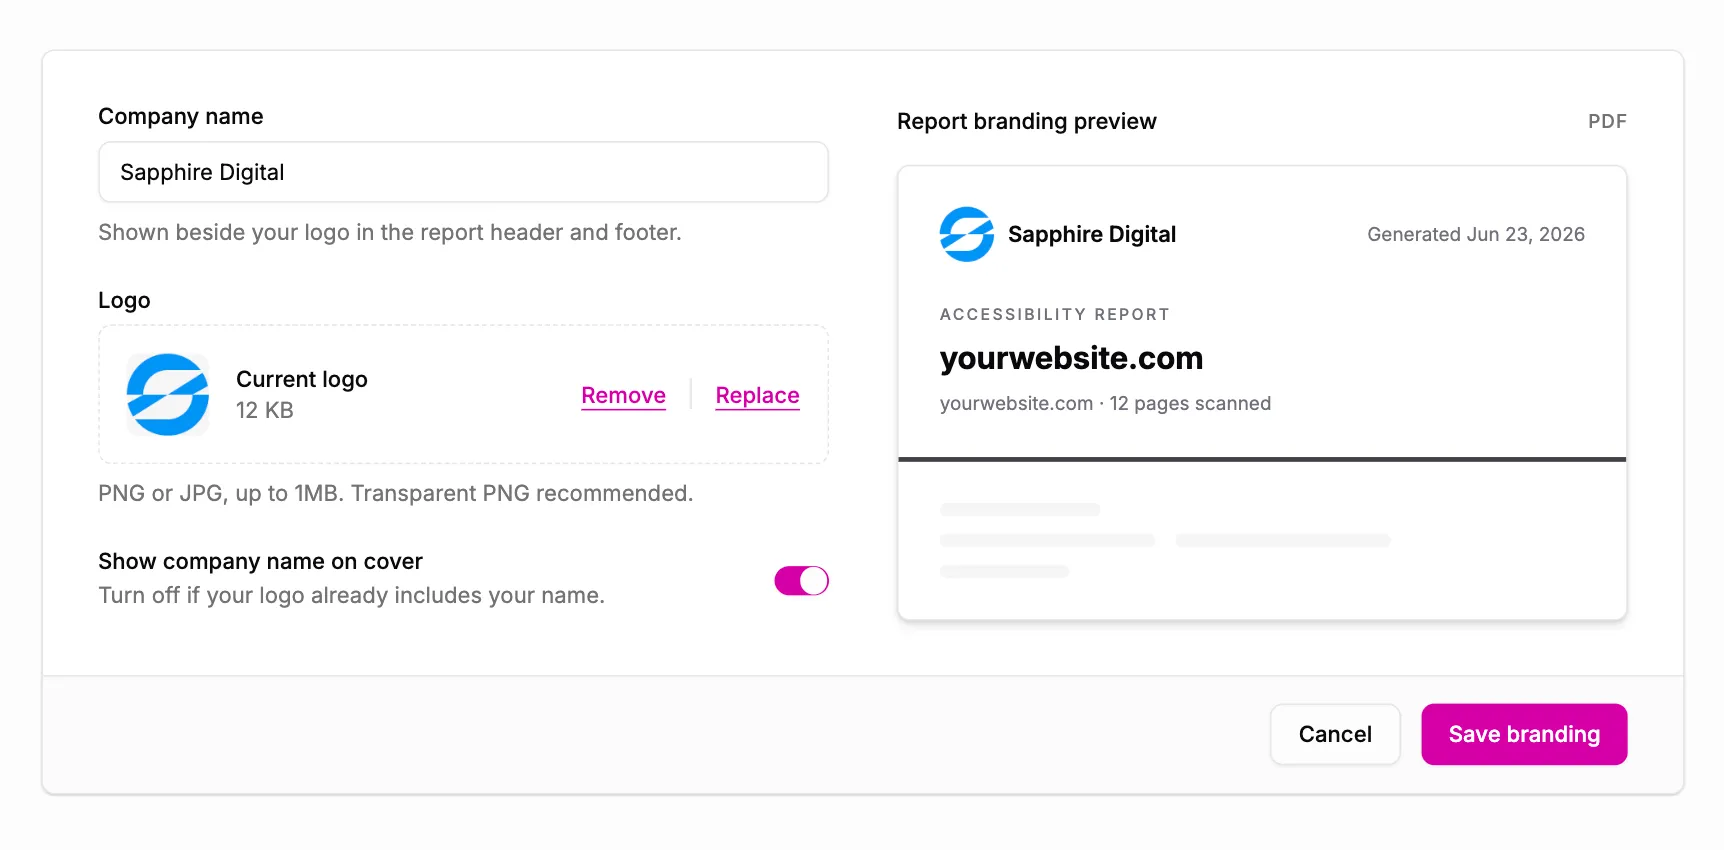
- Go to Settings → General and open the Report branding card.
- Upload your logo (PNG or JPG, up to 1 MB) and enter your company name.
- Optionally turn on Show company name on cover to display your name beside the logo on the cover. Leave it off if your logo already includes your name. Your company name always appears in the footer regardless of this setting.
- Check the live cover preview, then Save.
Applying it to a report
Once branding is set up, every report preview header includes a White-label branding toggle, on by default. Leave it on for a branded report, or turn it off for a standard A11y Pulse report. The choice applies to that download only — there’s no setting to remember.
If you haven’t set up branding yet, you’ll see a Set up white-label branding link in place of the toggle, which takes you to the branding page.
Plans and the trial watermark
Clean, fully branded reports are available on any paid plan (Starter, Growth, or Comprehensive). On a trial you can still set up branding and download a branded report to see how it looks, but it carries a diagonal DRAFT watermark across every page. The watermark is removed as soon as you subscribe to a paid plan, and it only applies to the downloaded PDF, not the in-app preview.
What’s in the report
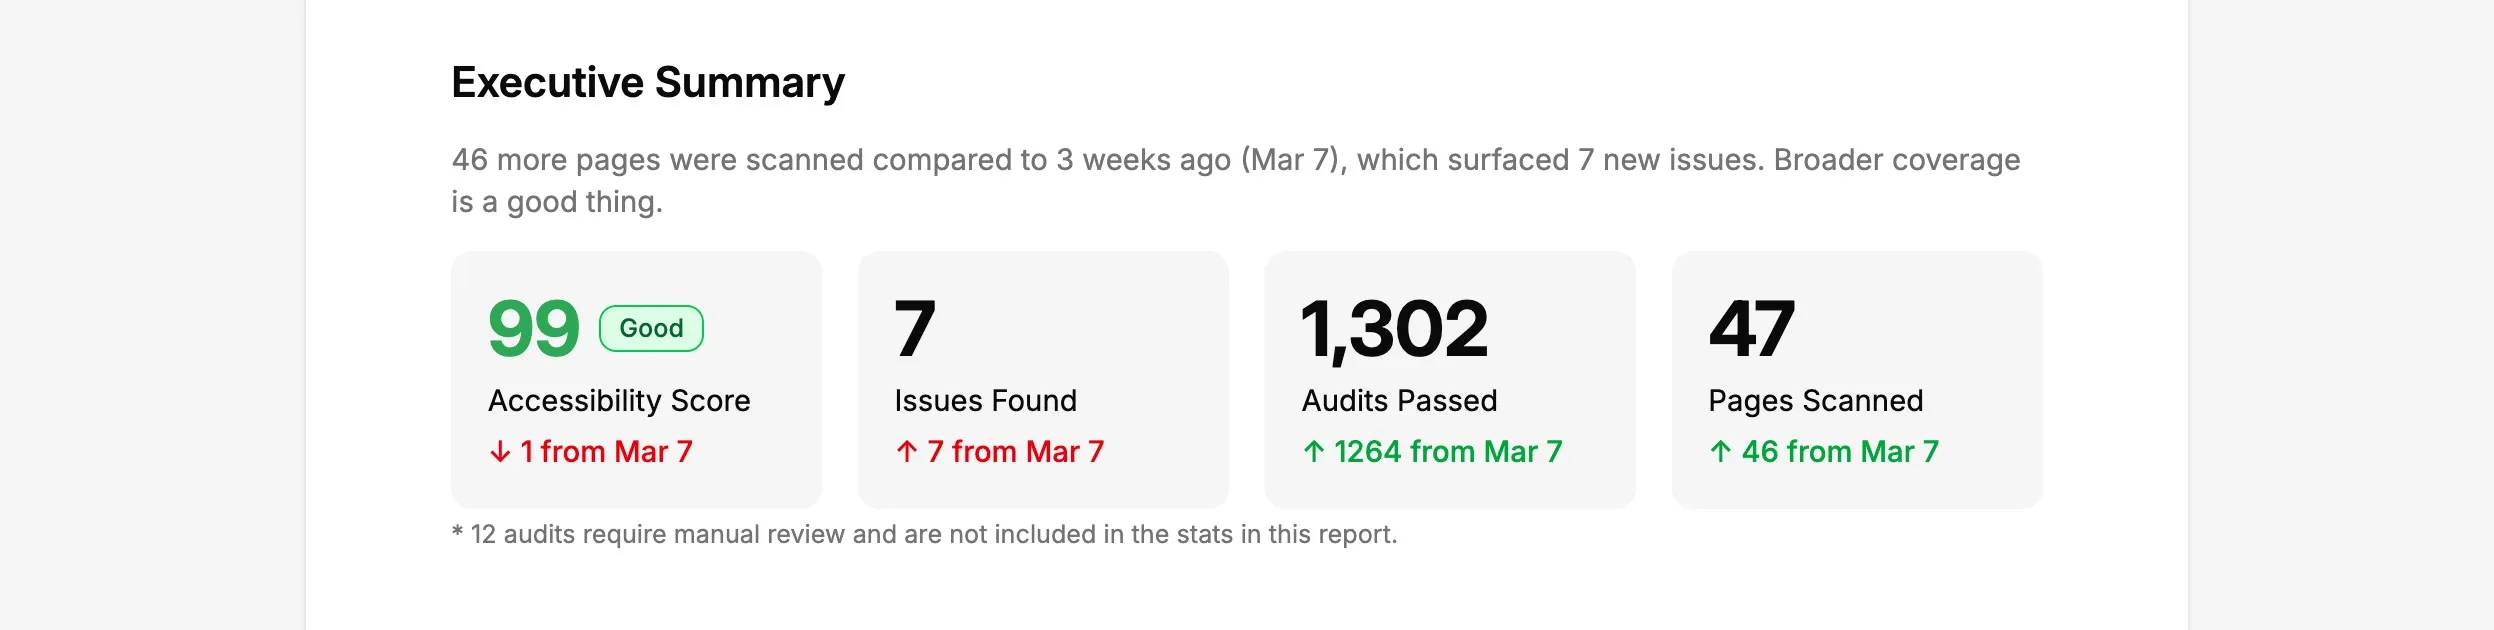
Executive summary
The first section gives a high-level snapshot: Accessibility score, issues found, audits passed and pages scanned. When you have previous scan data, each stat includes a comparison showing how things have changed (e.g., “↓ 4 vs Feb 8”).
Scan history
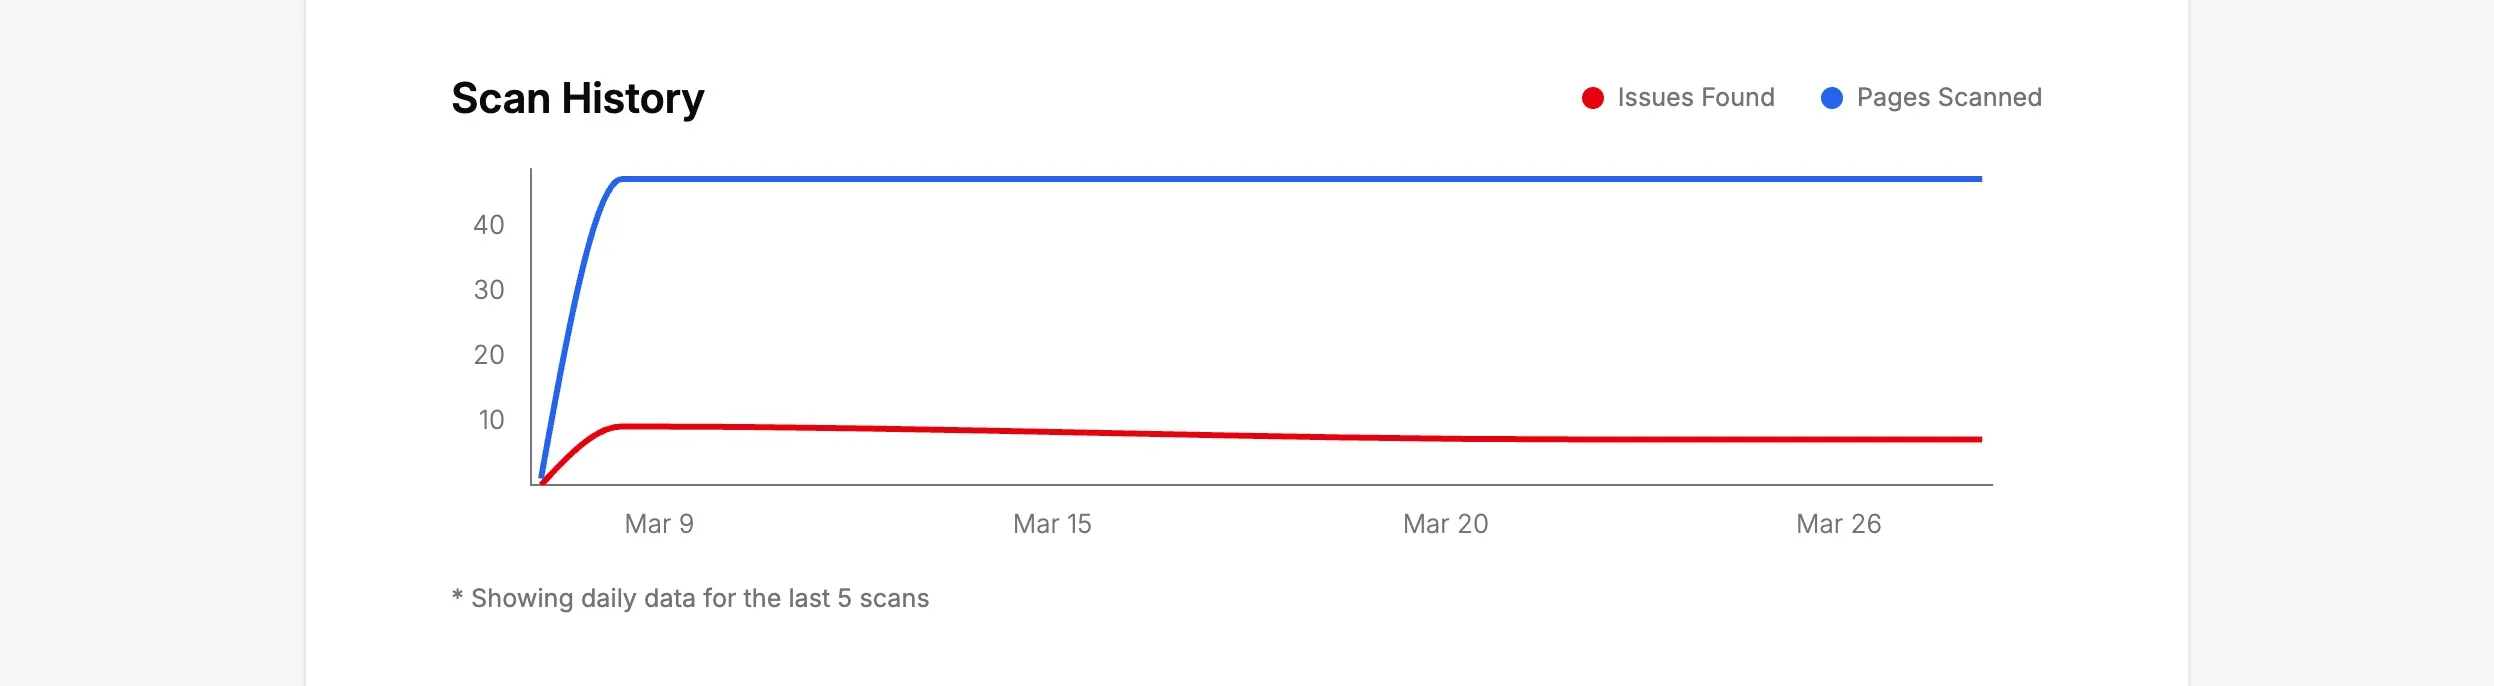
A chart shows how issues and pages scanned have changed over time. If your site has less than 12 months of history, all data is shown. For longer histories, the last 12 months are displayed.
If this is your first scan, the chart section is omitted — it will appear automatically once you have more scan data.
Issues and passed audits
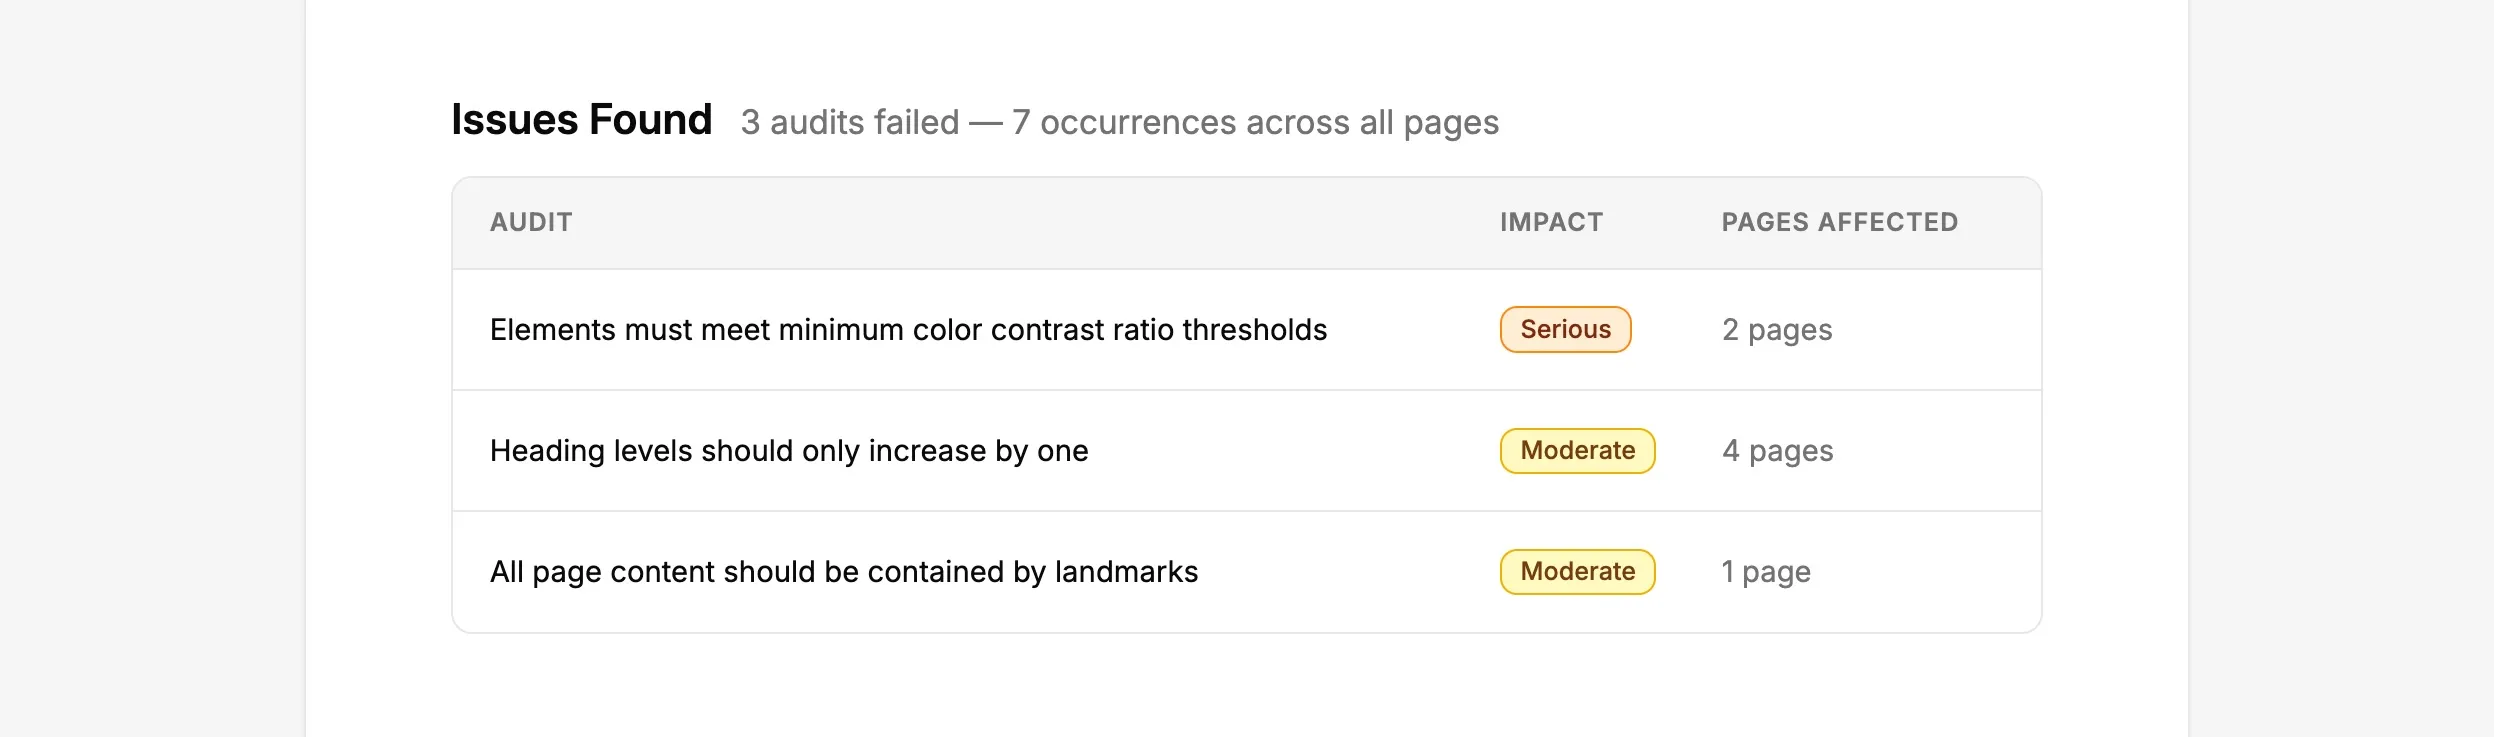
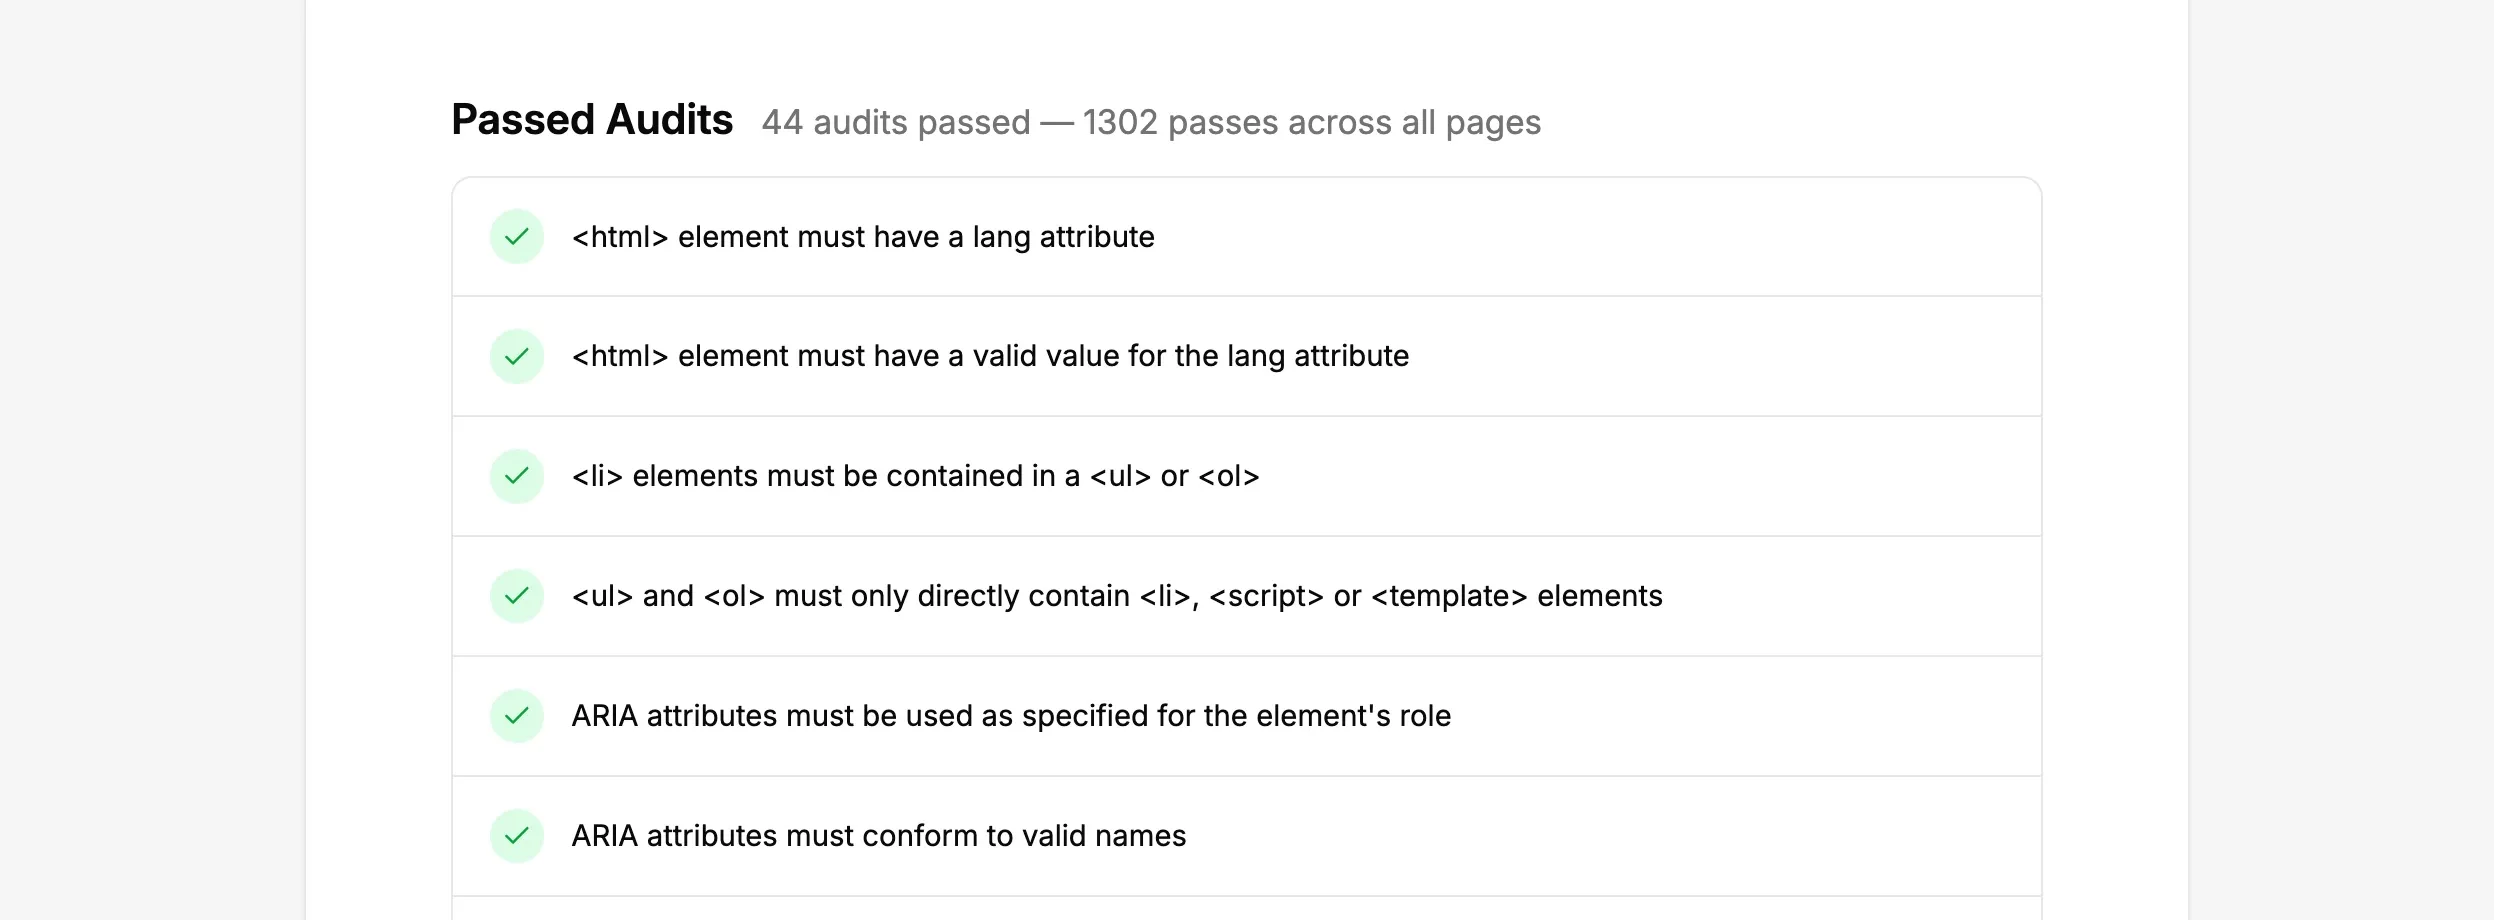
Failed audits are listed by impact level (critical, serious, moderate, minor) with the number of affected pages. Passed audits get equal attention — the full list is included to show what’s working well.
Detailed results (optional)
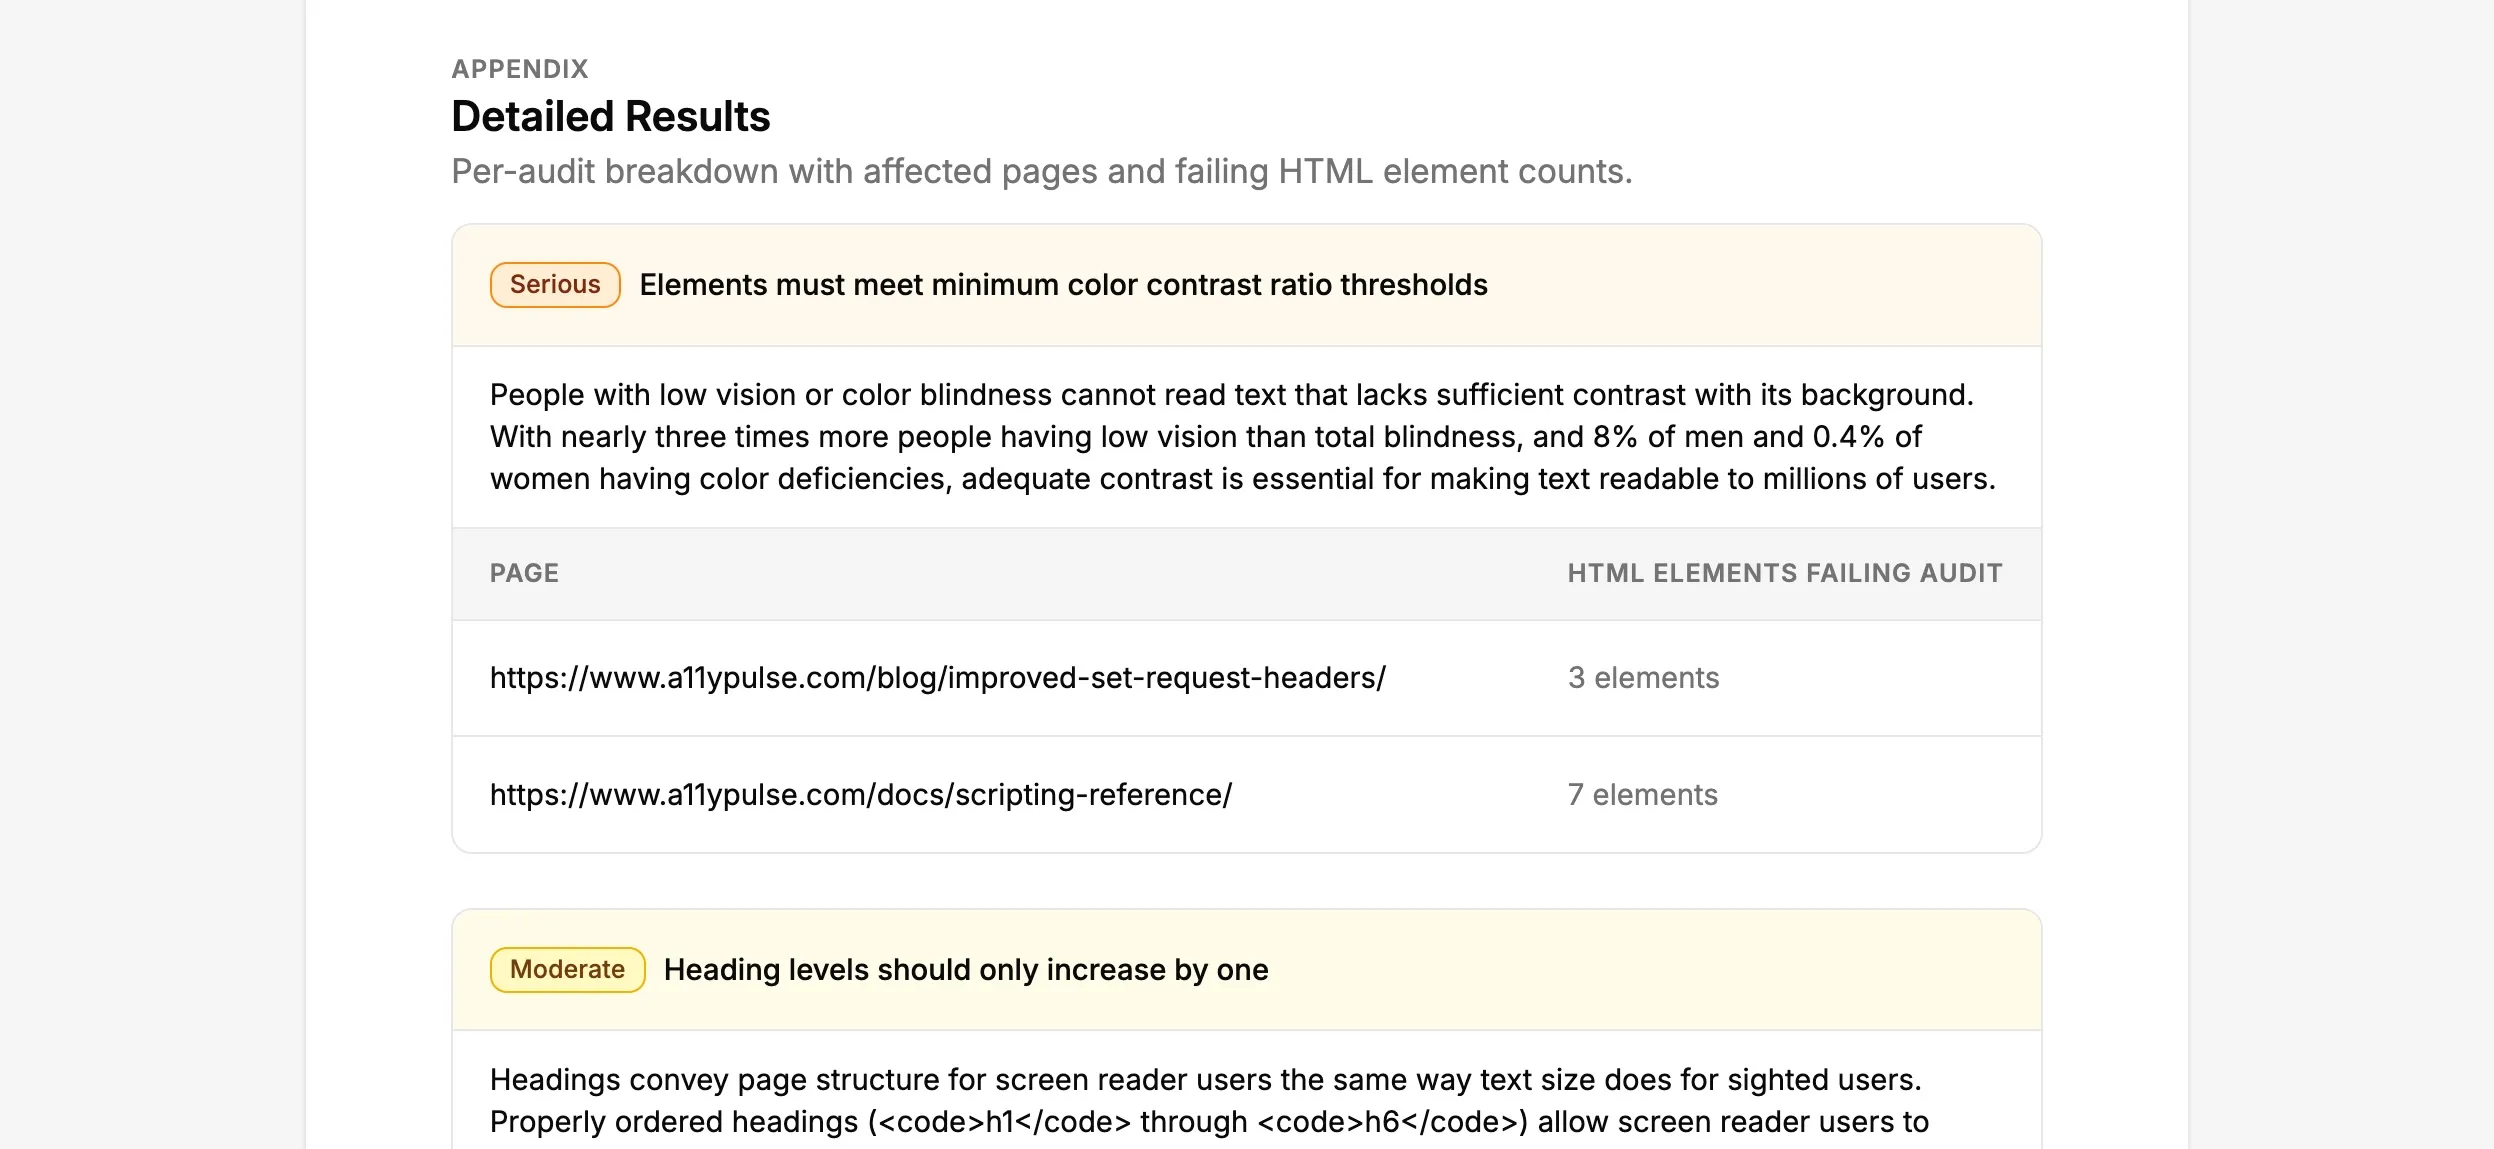
When “Show detailed results” is enabled, the report includes an appendix with full audit detail: a description of why each failed audit matters, which pages are affected, and how many HTML elements are failing on each page.
Downloading the PDF
Click Download PDF in the preview header. You’ll see a loading overlay while the PDF generates (usually a few seconds).
Good to know
- First scan? Your report will show absolute numbers without comparisons or a trend chart. These appear automatically after your second scan.
- No issues found? The report still generates — it leads with your passed audits. A clean scan is worth documenting.
- Large sites: Reports for sites with many pages and violations may take a few extra seconds to generate. The detailed results appendix adds length but won’t cause issues.
- Reports aren’t stored: Each PDF is generated fresh when you click download. If you need the same report again, just download it again from the same scan.
- Comparisons look back roughly one month: The delta comparisons in the executive summary compare against a scan from approximately 30 days ago, not the previous day’s scan. This gives a more meaningful picture of progress.